MAT is a memory analysis tool that monitors calls to malloc, realloc and free calls. It works with a small shared library libmat.so that is loaded into the program with the LD_PRELOAD dynamic linker feature (See the ld.so(8) man page). The library overrides the malloc, realloc and free function to monitor calls to these functions. It then writes or sends probe events which contain enough information for mat to tell what, when, where and by whom the memory allocation was done.
Using MAT the Memory Analysis Tool
By Stephane Carrez2015-05-25 09:51:00
mat will assign a unique number to each event that is collected. The tool will reconcile the events to find those that are related based on the allocation address so that it becomes possible to find forward and backward who allocates or releases the memory. When started, the tool provides a set of interactive commands that you can enter with the readline editing capabilities.
Instrumenting your application: the file event mode
The first method to instrument your application is by running your program and collecting the information into a file. Later, when the program is finished, use the mat tool to analyze the results.
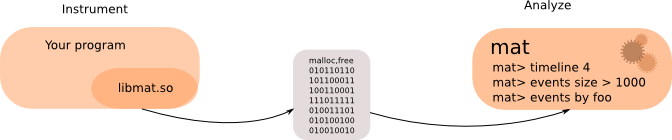
To instrument a program and save the results into a file, you can use the matl launcher as follows:
matl -o name command
where command is the command to instrument and name is the prefix file name. The generated file will have the process ID in its name with the .mat extension.
To start the analysis, you have to launch mat with the name of the generated file:
mat name-xxx.mat
Instrumenting live application: the TCP/IP socket mode
You can also instrument your application and do some analysis while your program is running. For this, you will use the TCP/IP socket mode provided by libmat.so and mat. You must first start the mat tool so that the TCP/IP server provided by mat is started before the program connects to it through the libmat.so shared library.
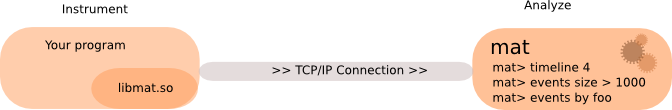
To use this mode, start mat in a first terminal console with either the -s or the -b option to start the TCP/IP server and wait for a program to connect. For example:
mat -b 192.168.0.17:4096
Then, in a second terminal console start your program through the matl launcher as follows:
matl -s 192.168.0.17:4606 command
Here you will give the IP address (you may use localhost or any IP) and the TCP/IP port (the default port used being the port 4606). The mat server may run on a different host with a different architecture.
General information
When mat reads the events, it detects the endianness and the size of pointers so that it is able to analyze 32-bit as well as 64-bit applications with little endian or big endian formats. The info command gives information about the program and the events that have been collected.
The output presented below come from the analysis of gdb 7.9.1 that was debugging mat.
mat>info
Pid              : 5291
Path             : /data/ext/gnu/i386/gdb-7.9.1/gdb/gdb
Endianness       : LITTLE_ENDIAN
Memory regions   : 24
Events           : 0..586514
Duration         : 41.26s
Stack frames     :  0
Malloc count     :  279768
Realloc count    :  36272
Free count       :  270462
Memory allocated : 8341613
Memory slots     :  10484
The number of collected events can be quite high, 586514 in the above example, and it can easily exceed several millions.
Timeline
With so many events, you may not know where to start. You can use the timeline command to analyse the events and find interesting groups and report information about them. The command takes a duration parameter to control the groups by defining the maximum duration in seconds of a group. For each group, the command indicates the event ID range, the number of malloc, realloc and free calls as well as the memory growth or shrink during the period.
mat>timeline 5
Start     End time  Duration  Event range         # malloc  # realloc # free    Memory
0us       4.32s     4.32s     0..533645           261393    20423     251923    +4618592
15.60s    20.57s    4.96s     533646..542619      4495      102       4379      +438803
20.62s    21.05s    432.68ms  542620..581167      11555     15663     11338     +3198744
26.16s    28.86s    2.70s     581168..582388      539       4         678       -9425
31.40s    32.41s    1.01s     582389..583133      288       11        446       +19246
In this sample, the first group correspond to gdb's startup during which it loads the symbol table. The second group correspond to the command b main followed by run in gdb. The third group is when the program reaches the breakpoint and gdb handles it and read the DWARF2 debugging information. The two last groups correspond to a step, where, cont and quit commands.
Looking at allocation sizes
The sizes command is another command that helps with many events as it counts and groups the events by their allocation size. Let's say we want to look further in the second group identified by the timeline 5 command, we can use the event range ID to filter out the events so that the sizes command only takes into account these events. By using the -c option, only a summary is printed by the command:
mat>sizes -c 542620..581167
Found 9550 different sizes, +3198744 bytes, with 11555 malloc, 15663 realloc, 11338 free
There are still many allocation and we can change the filter to report only the memory allocations greater than 75000 bytes. Now, we want to have all the information and the -c option is not given:
mat>sizes 542620..581167 and size > 75000
Event Id range                Time      Event               Size        Count   Total size  Memory
554191..554243                20.75s    realloc             75248        4      300992      -75240
565067                        20.88s    malloc              161323       1      161323      +161323
562816                        20.85s    malloc              179035       1      179035      +179035
564877                        20.87s    malloc              213328       1      213328      +213328
Found 7 different sizes, +730796 bytes, with 7 malloc, 1 realloc, 2 free
Looking at the event
When you identify some interesting event, you can use the event command and give it the event ID to dump the information with the complete stack frame. This is probably the most useful command as the stack frame helps you point out where in the code and by which flow the allocation call is made.
mat>event 554191
75248 bytes reallocated after 20.75s, freed 817us after by event 554243 +8 bytes
Id Frame Address         Function
 1 0x0000000000408898    _start
 2 0x00007F688D18AEC5    __libc_start_main (libc-start.c:321)
 3 0x0000000000408855    main (gdb.c:33)
 4 0x000000000054999B    gdb_main (main.c:1161)
 5 0x00000000005459F5    catch_errors (exceptions.c:237)
 6 0x0000000000549506    captured_main (main.c:1150)
 7 0x00000000005459F5    catch_errors (exceptions.c:237)
 8 0x00000000005484C3    captured_command_loop (main.c:329)
 9 0x000000000054EABE    start_event_loop (event-loop.c:334)
10 0x000000000054EA25    gdb_do_one_event (event-loop.c:296)
11 0x000000000054E755    gdb_wait_for_event (event-loop.c:773)
12 0x0000000000550482    inferior_event_handler (inf-loop.c:57)
13 0x000000000053A218    fetch_inferior_event (infrun.c:3273)
14 0x0000000000537E22    handle_signal_stop (infrun.c:4264)
15 0x000000000061B750    get_current_frame (frame.c:1486)
16 0x000000000054582C    catch_exceptions_with_msg (exceptions.c:189)
17 0x000000000061E36C    unwind_to_current_frame (frame.c:1451)
18 0x000000000061E081    get_prev_frame (frame.c:2212)
19 0x000000000061D949    get_prev_frame_always_1 (frame.c:1954)
20 0x000000000061B63B    compute_frame_id (frame.c:454)
21 0x000000000061EFAF    frame_unwind_find_by_frame (frame-unwind.c:157)
22 0x000000000061EBF6    frame_unwind_try_unwinder (frame-unwind.c:106)
23 0x00000000005CCEB4    dwarf2_frame_sniffer (dwarf2-frame.c:1405)
24 0x00000000005CCB38    dwarf2_frame_find_fde (dwarf2-frame.c:1772)
25 0x00000000005CC8E9    dwarf2_build_frame_info (dwarf2-frame.c:2313)
26 0x00000000005CAC4B    add_fde (dwarf2-frame.c:1812)
This event is a realloc call that reallocates a memory slot to 75248 bytes, the previous slot size was 75240 bytes. The operation that makes the call is add_fde in gdb.
Looking at frames
The frames command analyzes all the event stack frames and report the function with the number of calls and memory growth that they created. The command takes a level parameter that indicates the stack frame level to take into account. The level counts the stack frame starting from the bottom, so that level 1 should give you functions that directly call malloc, realloc and free functions.
A filter can be defined to control the allocation events to take into account. For example if we want to look at functions that allocate or free large memory blocks and which are in the second group reported by the timeline command, we can use the following command:
mat>frames 1 542620..581167 and size > 50000
Level Size      Count   Function
 1    -53328    1       bfd_elf64_slurp_symbol_table (elfcode.h:1172)
 1    +743794   8       __GI__obstack_newchunk (obstack.c:269)
 1    -187272   3       dwarf2_build_frame_info (dwarf2-frame.c:2451)
 1    +53328    1       bfd_elf_get_elf_syms (elf.c:419)
 1    -71104    1       _bfd_elf_canonicalize_dynamic_symtab (elf.c:7215)
 1    +461056   4       bfd_alloc (opncls.c:956)
 1    +25248    3156    add_fde (dwarf2-frame.c:1812)
 1    =75248    2       dwarf2_build_frame_info (dwarf2-frame.c:2422)
 1    -75248    1       dwarf2_frame_find_fde (dwarf2-frame.c:1772)
 1    +71104    1       bfd_elf_get_elf_syms (elf.c:453)
Download
You can download the first release of MAT and get mat sources at http://download.vacs.fr/mat/mat-1.0.0.tar.gz and follow the Build instructions.
Ubuntu 14.04 packages for 64-bit platforms are available:
http://download.vacs.fr/mat/mat_1.0.0_amd64.deb and http://download.vacs.fr/mat/libmat_1.0.0_amd64.deb
Ubuntu 14.04 packages for 32-bit platforms are available:
http://download.vacs.fr/mat/mat_1.0.0_i386.deb and http://download.vacs.fr/mat/libmat_1.0.0_i386.deb
Conclusion
Unlike valgrind, mat does not instrument the program. Instead, it overrides the malloc, realloc and free calls and only monitors these events. This makes the implementation easier to port and allows to use mat in some embedded systems where valgrind is more difficult to use (due to portability and memory resource constraints).
I've used mat on several Mips boards (BCM6362, BCM63168, Vox185) and it was very useful to understand the memory allocations and reduce the memory used by several programs. It does not yet provide a graphical front end but this will come one day.
Give it a try, you may find some interesting features in it!
Tags
- Facelet
- NetBSD
- framework
- Mysql
- generator
- files
- application
- gcc
- ReadyNAS
- Security
- binutils
- ELF
- JSF
- Java
- bacula
- Tutorial
- Apache
- COFF
- collaboration
- planning
- project
- upgrade
- AWA
- C
- EL
- J2EE
- UML
- php
- symfony
- Ethernet
- Ada
- FreeBSD
- Go
- KVM
- MDE
- Proxy
- STM32
- Servlet
- backup
- lvm
- multiprocessing
- web
- Bean
- Jenkins
- release
- OAuth
- ProjectBar
- REST
- Rewrite
- Sqlite
- Storage
- USB
- Ubuntu
- bison
- cache
- crash
- Linux
- firefox
- performance
- interview
Add a comment
To add a comment, you must be connected. Login