EtherScope is a monitoring tool that analyzes the Ethernet traffic. It runs on a STM32F746 board, reads the Ethernet packets, do some real-time analysis and displays the results on the 480x272 touch panel.
Ethernet Traffic Monitor on a STM32F746
By Stephane Carrez2016-09-30 19:19:00
The application is completely written in Ada 2012 with:
- The GNAT ARM embedded runtimes is the Ada 2012 ravenscar runtime that provides support for interrupts, tasks, protected objects and other Ada features.
- The Ada Embedded Network Stack is the small network library that provides network buffer management with an Ethernet driver for the STM32F746 board.
- The EtherScope application which performs the analysis and displays the information.
Traffic Analyzer
The traffic analyzer inspects the received packet and tries to find interesting information about it. The analyzer is able to recognize several protocols. New protocols may easily be added in the future. The first version supports:
- Analysis of Ethernet frame to identify the devices that are part of the network with their associated IP address and network utilization.
- Analysis of IPv4 packet to identify the main IPv4 protocols including ICMP, IGMP, UDP and TCP.
- Analysis of IGMP with discovery of subscribed multicast groups and monitoring of the associated UDP traffic.
- Analysis of TCP with the identification of some well known protocols such as http, https, ssh and others.
Each analyser collects the information and is able to report the number of bytes, number of packets and network bandwidth utilization. Some information is also collected in different graph tables so that we can provide some visual graph about the network bandwidth usage.
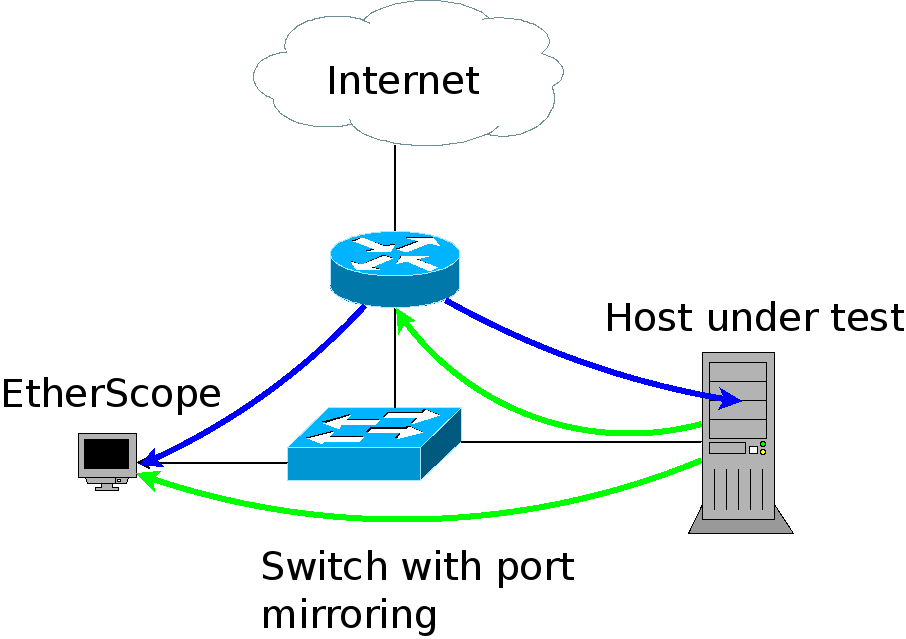
Network setup to use EtherScope
To use EtherScope, you will connect the STM32F746 board to an Ethernet switch that you insert or have on your network. By default, the switch will isolate the different ports (as opposite to a hub) and unicast traffic is directed only to the concerned port. In other words, EtherScope will only see broadcast and multi-cast traffic. In order to see the interesting traffic (TCP for example), you will need to configure the switch to do port mirroring. By doing so, you tell the switch to mirror all the traffic of a selected port to the mirror port. You will connect EtherScope to that mirror port and it will see all the mirrored traffic.
EtherScope in action
The following 4 minutes video shows the EtherScope in action.
EtherScope Internal Design
The EtherScope has several functional layers:
- The display layer manages the user interaction through the touch panel. It displays the information that was analyzed and manages the refresh of the display with its graphs.
- The packet analyzer inspects the traffic.
- The Ethernet network driver configures the Ethernet receive ring, handles interrupts and manages the reception of packets (the transmission part is not used for this project).
- The Ada Drivers Library provides a number of utility packages from their samples to manage the display and draw text as well as some geometric forms.
- The GNAT ARM ravenscar runtime provides low level support for the STM32 board configuration, interrupt and task management. It also brings a number of important drivers to control the touch panel, the button, SPI, I2C and other hardware components.
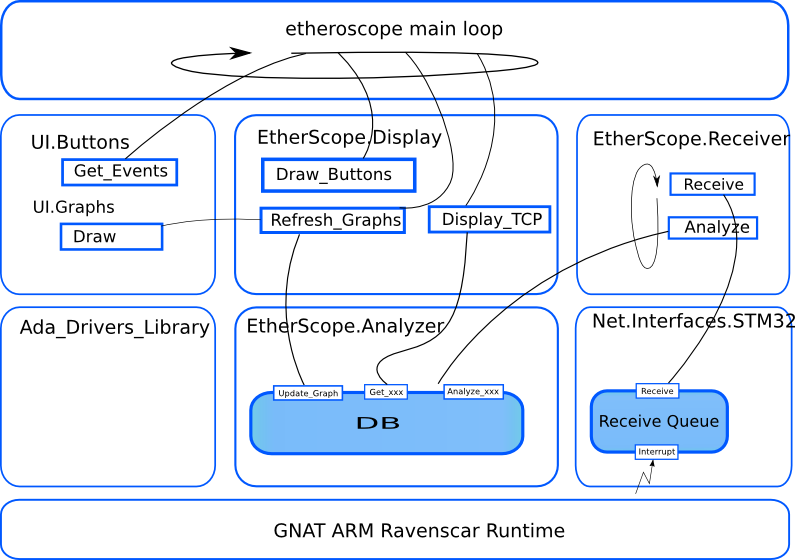
The EtherScope.Receiver is the package that has the receiver task that loops to receive a packet from the Ethernet driver and analyzer it through the analyzer. Because the result of the analysis is shared between two tasks, it is protected by the DB protected object.
The EtherScope.Display provides several operations to display the analysis in various forms depending on the user selection. Its operations are called repeatedly by the etherscope main loop. The display operation fetch the analysis from the DB protected object and format the result through the UI.Graphs or text presentations.
Conclusion
You can get the EtherScope sources at: https://github.com/stcarrez/etherscope Feel free to fork EtherScope, hack it and add new protocol analyzers.
The following analyzers could be implemented in the future:
- A DNS analyzer that shows which DNS requests are made,
- A DHCP analyzer to track and show IP allocation,
- A FTP analyzer to reconcile the ftp-data stream to the ftp flow,
- An IPv6 analyzer
Tags
- Facelet
- NetBSD
- framework
- Mysql
- generator
- files
- application
- gcc
- ReadyNAS
- Security
- binutils
- ELF
- JSF
- Java
- bacula
- Tutorial
- Apache
- COFF
- collaboration
- planning
- project
- upgrade
- AWA
- C
- EL
- J2EE
- UML
- php
- symfony
- Ethernet
- Ada
- FreeBSD
- Go
- KVM
- MDE
- Proxy
- STM32
- Servlet
- backup
- lvm
- multiprocessing
- web
- Bean
- Jenkins
- release
- OAuth
- ProjectBar
- REST
- Rewrite
- Sqlite
- Storage
- USB
- Ubuntu
- bison
- cache
- crash
- Linux
- firefox
- performance
- interview
Add a comment
To add a comment, you must be connected. Login